

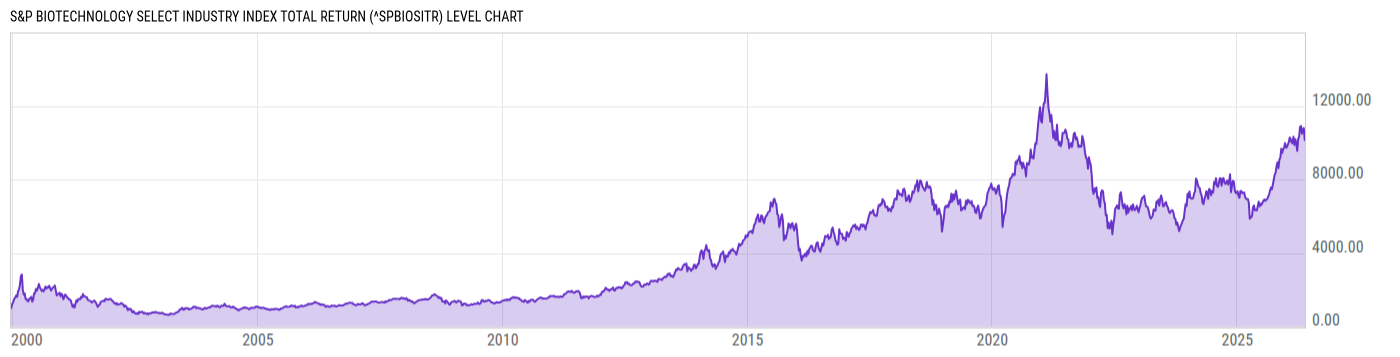
S&P Biotechnology Select Industry Index Total Return (^SPBIOSITR)
10457.10
-334.78
(-3.10%)
USD |
May 15, 17:33
Level Chart
Key Stats
Basic Info
| N/A | |
| Core Index Name | S&P Biotechnology Select Industry Index |
| Return Type | Total Return |
| Currency Code | USD |
| Category Hedge Type | Not Hedged |
Index Varieties
| Return Types | |
| Net Total Return | S&P Biotechnology Select Industry Index Net Total Return |
| Price Return | S&P Biotechnology Select Industry Index |
Total Return Performance
As of May 14, 2026.
Returns for periods of 1 year and above are annualized.
Annual Performance
As of May 15, 2026.
Basic Info
| N/A | |
| Core Index Name | S&P Biotechnology Select Industry Index |
| Return Type | Total Return |
| Currency Code | USD |
| Category Hedge Type | Not Hedged |
Index Varieties
| Return Types | |
| Net Total Return | S&P Biotechnology Select Industry Index Net Total Return |
| Price Return | S&P Biotechnology Select Industry Index |